Release status: unmaintained |
|
|---|---|
| Implementation | Parser extension, Parser function |
| Description | Provides reports and charts for Testopia |
| Author(s) | AndreasMuellertalk |
| Latest version | 0.4 (2009-06-14) |
| MediaWiki | 1.13,1.14,1.15 |
| License | GPL |
| Download | Project page Subversion [Help] Browse source code |
|
Parameters
$wgTestopiaReports = array(
  'host'        => name/IP of database host of Bugzilla
  'database'    => name of database
  'user'        => user for accessing the database
  'password'    => password for user
  'bzserver'    => http address for accessing Bugzilla, e.g. "http://localhost/bugzilla"
  'chartdevice' => device for rendering charts. Currently only "google" is supported
  'graphviz'	=> path to the executable "dot". "D:/graphviz/bin/dot"
);
|
|
What can this extension do?
Like the extension Bugzilla Reports this extension is aiming for integrating reports from Bugzilla addon Testopia. Furthemore is it able to produce charts using the Google Chart API. The reports are providing links through to Bugzilla and Testopia.
Due to its modular setup it should be easy to add additional reports.
Currently the following reports are included with more to come:
- Test Case Status Report per test run
- Priority Breakdown Report per test run
- Bug Status Report per test run
- Test plan and test cases
- Agenda - a report creating an agenda from the test cases inclueded in a test run using the dependencies
Some examples:
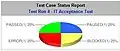 Testopia Status Report for a test run rendered as a pie chart
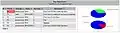 Testopia Bug Report
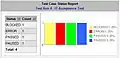 Status Report with bar chart
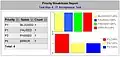 Priority Breakdown with bar chart
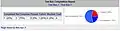 Completion Report with pie chart
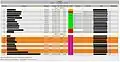 Report agenda with resource conflicts highlighted
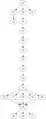 Dependency graph generated by report agenda using graphviz
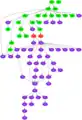 Colored dependency graph generated by report agenda using graphviz
It has been extensively tested with MySQL but not with PostgreSQL although it should work with that database too.
Usage
Basic Usage
To include a report a parser function is used:
{{#testopia:
|report_id=priority
|run_id=4}}
This will include the report only without chart. To render the data in form of a chart an additional parameter must be included:
{{#testopia:
|report_id=priority
|run_id=4
|charttype=pie}}
This will render the same report but with 2D pie chart attached to it.
More complex example
{{#testopia:
|report_id=testplan
|plan_id=6
|showhide=true
|hidden=true
|chart=testers,tstatus,category,tprio
|charttype=pie3,pie,pie3,bar
|chartpos=top
|chartlayout=2
|chartwidth=500,400,450,400}}
This will render the report
- testplan
- with four charts testers,tstatus,category,tprio
- rendered as pie3,pie,pie3 and bar chart
- with the widths 500,400,450,400
- positioned above the data table
- as 2x2 grid
- the report be will initially minimized and could be expanded by the user by pressing the button "Show"
{{#testopia:
|report_id=agenda
|run_id=2
|reportoptions=starthour=8,startminute=0,endhour=18,endminute=0}}
This will render the report agenda for test run 2 using some report options.
Parameters
Complete list of all parameters:
| Parameter | Possible Values | Description |
|---|---|---|
| report_id (mandatory) | status,bugs,priority,completion,testplan | Defining the report that should be rendered:
|
| run_id (mandatory, if plan_id not set) | Testopia ID of the test run | |
| plan_id (mandatory, if run_id not set) | Testopia ID of the test plan | |
| charttype |
|
Chart type to render. This parameter might no be supported by all reports. |
| chart | depending on the report
|
If a report is capable of rendering more than one dimension of the table, this could be specified by this parameter. If more than chart should be rendered, the charts must be comma separated. Example: status,prio |
| chartlayout | horizontal,vertical, <number> | Horizontal or vertical alignment of charts. If <number> is used this is specifying the number of colums for charts. E.g. 2 will create a grid with two columns and x rows of charts. |
| chartpos | top,right,bottom,left | The position of the charts relative to the data table. Default: right |
| nudechart | true or false | Setting to true will display the chart(s) only and completely nude (without any surrounding tables) |
| showhide | true or false | A button will be displayed to hide or show the report. This requires JavaScript to be enabled. |
| hidden | true or false | If using parameter "showhide" this defines the initial state of the report. If set to true the report will be hidden when the pages is opened. |
| chartwidth | size in pixel or auto | If more than chart is displayed the widths could be separated by a comma. If less widths are specified than charts the last width will be used for the remainders. Using "auto" will use the build-in default or it will try to calculate it. |
| chartheight | size in pixel or auto | If more than chart is displayed the heights could be separated by a comma. If less heights are specified than charts the last height will be used for the remainders. Using "auto" will use the build-in default or it will try to calculate it. |
| total | true or false | Showing a line with a total below the report |
| sortable | true or false | Using the MediaWiki table class "sortable" |
| zebra | true or false | If true alternative line color will be used |
| hidetable | true or false | When rendering a chart, this parameter is hiding the data table. |
| debug | true or false | This will display some additional data for finding bugs in this extension. |
| title | true or false | If true the charts will have a title. Default is true. |
| roundperc | numeric value | Number of decimals to that a percentage will be rounded. The default is 0. |
| reportoptions | Specific options per report | Set of specific options per report. Currently only support by report "agenda". |
Download instructions
Download the latest version from Google Code.
Installation
To install this extension, add the following to LocalSettings.php:
#add configuration parameters here
require_once($IP."/extensions/TestopiaReports/TestopiaReports.php");
and add the configuration block described below. If you are having an older installation, delete the old directory first.
Configuration parameters
| Parameter | Description |
|---|---|
| host | Name or IP address of the database hosting the Bugzilla data |
| database | Name of the Bugzilla database. In most of the cases this should be bugs |
| user | Name of the user for accessing the Bugzilla database. This user only needs read access. |
| password | Password for the user for accessing the Bugzilla database. |
| bzserver | Http address for accessing Bugzilla, e.g. "http://localhost/bugzilla" |
| chartdevice | Device for rendering charts, could be "google". |
| graphviz | Path to the graphviz executable "dot", e.g. on a Windows system:"D:/graphviz/bin/dot". This could be omitted if not dependency graphs are needed for report "agenda". |
Configuration example (Windows + Google Chart API):
$wgTestopiaReports = array(
 'host'        => "localhost",
 'database'    => "bugs",
 'user'        => "bugs",
 'password'    => "mypassword",
 'bzserver'    => "http://localhost/bugzilla",
 'chartdevice' => "google",
 'graphviz'    => "D:/graphviz/bin/dot"
);
Graphviz
Graphviz could be downloaded here: http://www.graphviz.org/
Follow the installation instructions and and the set parameter "graphviz" in Localsettings.php accordingly. Under Windows the graphviz should be installed in a path not having spaces. This extension has been tested with version 2.22.2.
Customization
Styles
Nearly every aspect of the appearance could be changed by changing the CSS file /skins/tr_main.css. If the result table is displayed with the sorted feature, the MediaWiki build-in class sortable is used.
Reports
Creating new reports
... not yet written ...
Chart Colors
If you do not like the pre-defined colors feel free to change them in class TR_Colors.php. Every color used for the charts is defined there.
Release Notes
Version 0.4 - 14.06.2009
- bug fixes
- fixed percentage calculation in report completion
- cases not showing up in report "Test Plan" if there is no tester attached
- enhancements
- added more elements to the CSS file for customizing the appearance
- added titles to the charts
- added tooltips to the charts
- added alternative texts to the charts (will be displayed if the grahic for the chart could not be displayed)
- new parameter: title - (true, false); hides or shows the title of charts; default: true
- new parameter: reportoptions (list of additional pairs of parameters (param=value) for reports separated by comma
- new parameter: roundperc; number of decimals for percentage rounding (e.g. roundperc=2); default: 0
- new parameter for Localsettings.php: graphviz - for specifying the location of the program "dot" for generating dependency graphs
- changed all reports to use TR_SQL
- enhacements in class TR_SQL (functions: addField, addWhere, addJoin)
- enhacements for report framework
- new custom function for data new line (for injecting extra lines)
- new custom function for beginning a new line (for modifying the complete style of one line)
- new custom function for init (for initialising the report)
- new custom function for column formatting (getColumnFormats) only if the cell is not rendered by the custom render function
- new custom function "injectBody" for injecting the body of a report while using renderPlainHTML
- new report "agenda": automatically creating the agenda for a test run using the test case dependencies. If graphviz is installed a dependency graph will be created. This report is supporting the following reportoptions:
- starthour (default: 8) The start hour for one test day. Test cases will be scheduled using this start time
- startminute (default: 0) See starthour
- endhour (default: 18) The end hour for one test day.
- endminute (default: 0) See endhour
- startdate (default: current system date) Agenda will start on this day.
- ignoreweekends (default: false) If false, test case won't be scheduled on week ends
- withdependency (default: true) If true only cases with dependencies will be included in the agenda
- highlightresconfl (default: true) If a resource conflict is detected (same tester) the corresponding rows will be highlighted
- dependencygraphonly (default: false) Shows only the dependency graph
- improvements for report "Test Plan"
- highlighting durations with 00:00:00
- highlighting cases without tester
- highlighting cases that are proposed
- marking disabled test cases (whole line will be dimmed)
- others
- removed support for ploticus; maybe I will pick up it later but for the moment it is too complex to include
Version 0.3 - 23.05.2009
- bug fixes
- fixed typo in a report name; now it is completion
- fixed wrong counter in charts for Priority Breakdown Report
- fixed the last (total) line in each table if the table is sortable
- enhancements
- added possibility to set the message (per report) that is being displayed when no results were found by the query (function setMsgNoResultsFound)
- parameter "sortable" is now per default set to false
- clean up of routine renderPlainHTML
- new parameter: chartpos - position relative to the data table (left, top, right, bottom); default: right
- new parameter: chartlayout - alignment of charts (vertical, horizontal); default: vertical
- new parameter: nudechart - (true, false); if true the chart will be shown without any table surrounding it; default: false
- new parameter: showhide - (true, false); if true buttons will be displayed to hide and show the table and chart; needs java script to be enabled
- new parameter: hidden - (true, false); if using parameter "showhide", "hidden" will control the initial status. If true the table and chart will initial be hidden
- if a report could render more than one chart at a time, now the chart type (bar, pie, ...) could be specified per chart (simply add more types and delimit them with ",")
- renamed "charts" to "chart" and "chart" to "charttype" for more clarity
- added new value(s) to parameter "chartlayout": instead of giving "horizontal" or "vertical" a number could be given. This number will be the number of columns. E.g., 2 = two colums. If three or more charts they will be displayed in more than on row. Each row having two charts.
- new report "testplan" with details about the test cases for a testplan. Supported charts: tstatus (test case status), testers (assignments to tester), prio (priority of test cases), category (assignments to category)
Version 0.2 - 07.05.2009
- bug fixes:
- extension is now behaving correctly if no results are found and is no longer messing the complete screen
- debug flag is now working even if the result set is not empty
- enhancements:
- added new report "completion" which is basically the report included in Testopia
- introduced report footer for adding additional information at the end of the report
- added some more strings to the localisation file
- added some more inline documentation
- changed routine for adding debug information
Version 0.1 - 29.04.2009
- initial experimental release with three reports and Ploticus and Google Charts support