Release status: unmaintained |
|
|---|---|
 |
|
| Implementation | Tag |
| Description | Graph plotting extension using the <canvas> element. |
| Author(s) | (sk197876talk) |
| Latest version | 0.01 (2008-08-31) |
| MediaWiki | |
| License | GPL (excluding excanvas) |
| Download | wykres.tar.gz |
|
Hooks used
|
|
What can this extension do?
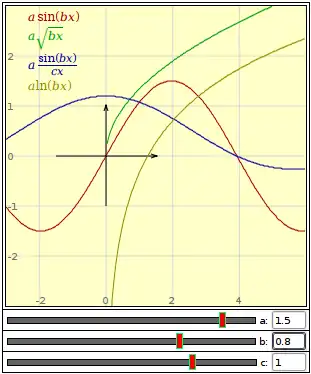
It can plot a couple of graphs of some functions with parameters. The parameters can be adjusted using handy sliders.
Usage
This example will draw four graphs on a canvas 300 pixels wide and 300 pixels high.
<wykres width="300" height="300" x="-3:6" y="-3:3" par="a[-2:3] b[-2:3] c[-2:3]">
    a*sin(b*x); a*sqrt(b*x); a*sin(b*x) / (c*x); a * ln(b*x)
</wykres>
Download instructions
Get it from wykres.tar.gz.
Installation
To install this extension
- extract
wykres.tar.gzinsidewiki/extensionsdirectory. - add the following to LocalSettings.php:
require_once("$IP/extensions/wykres/wykres.php");
Configuration parameters
There are none. You can configure the look and feel modifying wykres/css/wykres.css and wykres/js/wykresStyles.js.
User rights
None.
This article is issued from Mediawiki. The text is licensed under Creative Commons - Attribution - Sharealike. Additional terms may apply for the media files.