Release status: unmaintained |
|
|---|---|
| Implementation | Tag, Special page |
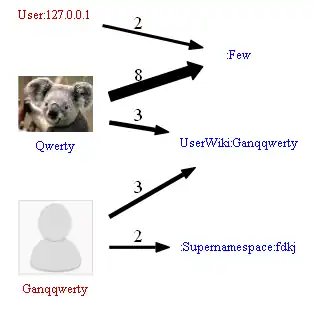
| Description | Shows editor's contribution in a graphical form. The more the author contributed - the thicker will be the line in a graph! |
| Author(s) | Katkov Yurytalk |
| Latest version | 0.3 |
| MediaWiki | 1.19 |
| PHP | 5.1+ |
| License | GNU Lesser General Public License 2.1 |
| Download | GitHub: Note: |
|
Tags
<collaborationdia> |
|
|
Hooks used
|
|
The Collaboration Diagram extension allows one to visualize the graph of users' contribution. The extension can draw the following diagrams
- The diagram of user contribution for the given article.
- The diagram for several articles.
- The diagram for all pages in the given category.
It uses the free graph drawing program GraphViz and GraphVizExtension for creating and rendering graphs.
In the diagram the user contributed the most will have the thickest arrow pointed to the article. That can be funny and useful form of article eition summary.
Installation
- Dependencies
- GraphViz
- Extension:GraphViz
- Extension:SocialProfile if you want avatars to be shown on a diagram.
To install this extension, first you should install the dependencies.
- Download] and place the file(s) in a directory called
CollaborationDiagramin yourextensions/folder. - Add the following code at the bottom of your LocalSettings.php file:
require_once "$IP/extensions/CollaborationDiagram/CollaborationDiagram.php";
- Configure as required
- in the file "CollaborationDiagram.php" change all variables from wfMsgForContent to wfMessage
- in the file "CollaborationDiagram_body.php" change the line 31 for this code:
$output->addWikiTextAsInterface->$boilerplates;
 Done – Navigate to Special:Version on your wiki to verify that the extension is successfully installed.
Configuration
There are some configuration option that allow you to more fully enjoy the extension:
| Parameter | Default Value | Values | Description |
|---|---|---|---|
$wgCollaborationDiagramDiagramType | graphviz-thickness | graphviz-figures, graphviz-thickness | The type of diagram to use on this site. Here graphviz-figures is more compact representation |
$wgCollDiaUseSocProfilePicture | false | true, false | Allows using avatars of the users in Collaboration diagram. Requires SocialProfile to be installed |
$wgCollaborationDiagramMinEdit | not set | 1,2,3... any integer | Don't show editors who have less that the noted amount of edits. |
$wgCollaborationDiagramSkinFilename | default.dot | deafult.dot, fdp.dot, circo.dot, vertical.dot, neato.dot or user skin | Filename of the skin to use on that site. |
$wgCollaborationDiagramConvertToPNG | false | true, false | Setting this option to true will make collaboration diagram to use ImageMagick to convert jpg avatars to png. This option can be useful if your graphviz version can't make graphs with embedded jpg pictures. You need to have $useImageMagick set to true and$wgImageMagickConvertCommand set to the convert command. |
$wgCollaborationDiagramUserIcon | user_icon.png in extension folder | any path to the image | Set the user icon for the compact view. This option will have effect only if $wgCollaborationDiagramDiagramType is set tographviz-figures |
Usage
Here are examples of using the collaborationdia tag.
Diagram for current page
To insert the diagram for the current page just place the collaborationdia tag anywhere in the article:
<collaborationdia />
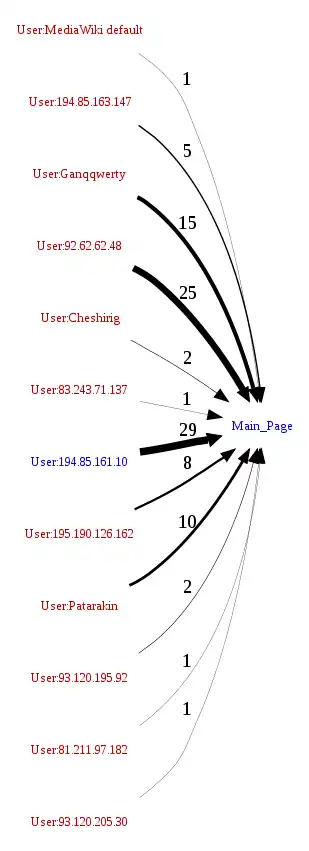
Diagram for one page
If you want to draw the diagram for the specific page use the collaborationdia tag with page parameter
<collaborationdia page="RDF_test"/>
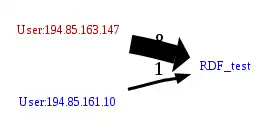
Diagram for the set of pages
Do you want to see who contributed in several pages? It's easy too: just use the page parameter for the list of names delimited by semicolon.
<collaborationdia page="Katkov;RDF_test;Main_Page"/>
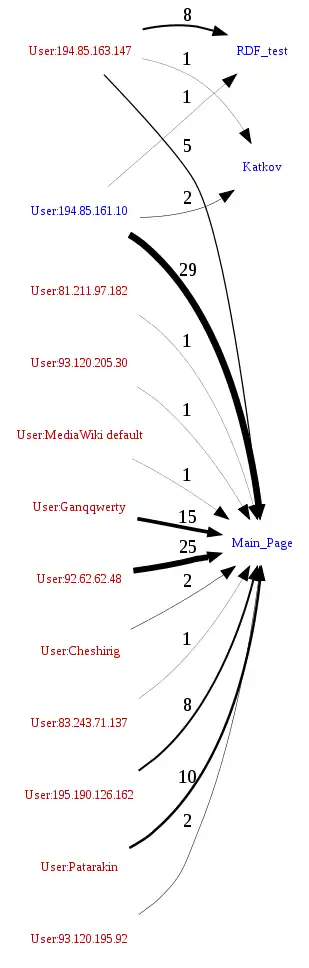
Diagram for all pages in category
Another option is to view the diagram for the given category. Use the category parameter for that.
<collaborationdia category="Test"/>
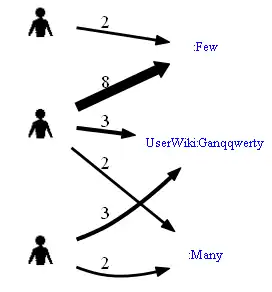
Compact mode
If your diagram are too huge and you need more compact mode you can configure CollaborationDiagram for that. This is an example of filtering the authors who make only one edits and the figures view. Set the following in your LocalSettings.php:
$wgCollaborationDiagramMinEdit=1;
$wgCollaborationDiagramDiagramType="graphviz-figures";
And all the diagrams will look like that
Social Profile Integration
If you have Extension:SocialProfile installed there's one more cool option possible. In the standard mode it's possible to show avatars of users in a Collaboration Diagram. Just set the $wgCollDiaUseSocProfilePicture=true; and all the diagrams will be looking like that:
Special Page and tab
Go to <yourwikiurl>?title=Special:CollaborationDiagram&page=<Your_pagename> and you'll see collaboration diagram for the page Your_pagename. Alternatively you can click on the tab collaborationdiagram that located near the History tab. This tab is porved to be working on Vector and Monobook skins.
![]()
Skin support
In our terminology skin is a header of generated graphviz code. The default skin is default.dot located in the Collaboration Diagram extension folder. You can write your own skin, put it in the extension folder and set $wgCollaborationDiagramSkinFilename to the skin filename in LocalSettings.php:
$wgCollaborationDiagramSkinFilename='mycoolskin.dot';
There are two skins there by default: the default skin and fdp skin. Here are some examples of using skins:
 fdp skin without SocialProfile
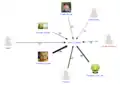 circo skin with SocialProfile
 default skin with SocialProfile
 fdp skin with SocialProfile
 vertical skin with SocialProfile
Further work
0.2 version includes a lot more features that 0.1 but still the're are more to come! For example I want to make graphviz graphs prettier, add shadows and gradients so they could look cool. There is also a number of other ideas for viewing users' contributions. Seeproject tracker for gory details.
Theory
From: Bipartite Networks of Wikipedias Articles and Authors: a Meso-level Approach A bipartite network is a graph G = (U, V, E) whose vertices (or `nodes') can be divided into two disjoint sets U and V such that every edge (or `link') E connects a vertex in U to a vertex in V; that is, U and V are independent sets.
When we consider articles in Wikipedia and their editors, a bipartite network is a convenient representation: U is the set of editors and V is the set of articles in Wikipedia. The bipartite network formalism is ideal for studying collaboration, because the network structure encodes knowledge about which articles editors have edited together. By studying the clusters (or `modules') in the bipartite network, we are able to discover clustering of editors and articles and smaller patterns of collaboration. These dense groups could also be called 'epistemic communities' as used by Roth (2006) [12] where epistemic communities are understood as a descriptive instance only, not as a coalition of people who have some interest to stay in the community: it is a set of agents who participate in building the same knowledge.
Camille Roth, "Co-evolution in Epistemic Networks Reconstructing Social Complex Systems", Structure and Dynamics: eJournal of Anthropological and Related Sciences : Vol. 1: No. 3, Article 2, 2006.
See also
| This extension was migrated from Google code and checked into a GitHub software repository. |